Last June, I compared the early 80s recovery under Ronald Reagan to the current recovery. I presented two graphs which compared total government spending and total government employment during the two recoveries. It turned out that government spending and employment both grew more during the Reagan recovery.
It’s been nine months since then. How have things changed?
The current recession began 62 months ago. Reagan’s recession officially began in July 1981 – so 62 months later would be September 1986.
At this point in Reagan’s Recovery (compared to start of recession):
- Total government spending was up 51%.
- Government employment was up 750,000.

Today (compared to start of recession):
- Total government spending is up 22%.
- Government employment is down 500,000.
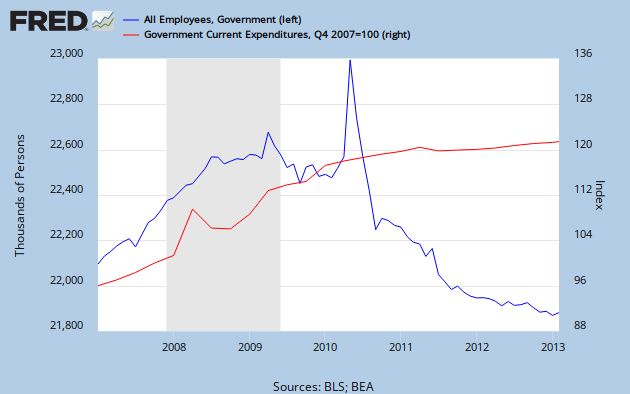
Had total government spending and employment followed the same trend in this recovery as the 80s recovery, spending would be $895B higher and there would be 1,250,000 more government employees. Also, during the 80s recovery, the top income tax rate was cut from 70% to 28%. Had the current administration had the option of implementing those kinds of tax cuts and spending increases, the economy would be booming right now. The 80s recovery was fueled by massive government stimulus. Today’s recovery is struggling with austerity.
The American Dream is a term coined by James Truslow Adams in his 1931 book, The Epic of America. He defined it as:
…that dream of a land in which life should be better and richer and fuller for everyone, with opportunity for each according to ability or achievement. It is a difficult dream for the European upper classes to interpret adequately, and too many of us ourselves have grown weary and mistrustful of it. It is not a dream of motor cars and high wages merely, but a dream of social order in which each man and each woman shall be able to attain to the fullest stature of which they are innately capable, and be recognized by others for what they are, regardless of the fortuitous circumstances of birth or position.
A dream that anyone can realize their full potential. Where it doesn’t matter if you are born poor or rich, you can achieve your goals. Even though I was born into a lower middle class family, I was able to achieve my goals. Unfortunately, I’m not sure the same opportunity exists today.
In 1980, I began attending the University of California, Los Angeles (UCLA). That same year, I also got a job as a grocery store cashier. From the 1980-81 UCLA catalog, total estimated expenses for that year were $1,713 for someone living at home – as I was. Considering that my starting pay was $7.50/hr, and I averaged a little over 20 hours per week, I could cover all of my annual education expenses with about 3 months of work.
Today, the situation is very different. I was shocked to recently discover that starting pay for a grocery store cashier in Los Angeles is only $7.97 – virtually the same as it was over 30 years ago! However, annual expenses at UCLA have risen to $14,010 for 2012-13. It would now take over 20 months of work to cover annual education expenses! (Note: There are only 12 months in a year!)
How did this happen?
- Stagnant entry-level wages – Had incomes for grocery clerks kept up with inflation, the starting wage today would be $20.15 – not $7.97.
- Declining public funding – In 1980, total public funding (state and federal) for California higher eduction was $4.9B out of a total of $34.5B – 14.3%. Last year, it was only $15.3B out of $213B – 7.2%.
But this problem isn’t unique to California. Nationwide, the result of lagging entry-level wages and rising education costs have resulted in an explosion of student debt. The latest data from the 2010 Survey of Consumer Finances show that average inflation-adjusted debt has tripled since 1989.

From the Associated Press:
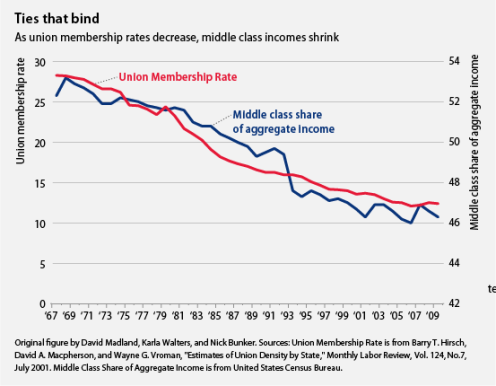
Union membership plummeted last year to the lowest level since the 1930s as cash-strapped state and local governments shed workers and unions had difficulty organizing new members in the private sector despite signs of an improving economy.
Government figures released Wednesday showed union membership declined from 11.8 percent to 11.3 percent of the workforce, another blow to a labor movement already stretched thin by battles in Wisconsin, Indiana, Michigan and other states to curb bargaining rights and weaken union clout.
Lowest since the 1930s? Maybe it isn’t a coincidence that low union membership rates lead to extremely weak economies.
The picture is even worse for the private sector.
But unions also saw losses in the private sector even as the economy created 1.8 million new jobs in 2012. That membership rate fell from 6.9 percent to 6.6 percent, a troubling sign for the future of organized labor, as job growth generally has taken place at nonunion companies.
Union membership peaked in 1953 at 28%. That year, the unemployment rate was 2.5%. Today it’s down to 11.3% and the unemployment rate is 7.8%. So much for the belief that unions kill jobs! What many people forget is that union employees are also consumers. When union membership declines, so do wages. But when wages fall, workers have less disposable income. This leads to lower consumer demand – and consumer demand is ultimately what creates jobs.
Many people also forget that no union contract can be forced onto any employer. All unions do is give employees more bargaining power. The father of capitalism, Adam Smith, understood that even when employees are unionized, employers still have the upper hand in negotiations. Unions don’t level the playing field, they just make it less uneven.
“What are the common wages of labour, depends everywhere upon the contract usually made between those two parties, whose interests are by no means the same. The workmen desire to get as much, the masters to give as little as possible. The former are disposed to combine in order to raise, the latter in order to lower the wages of labour.
It is not, however, difficult to foresee which of the two parties must, upon all ordinary occasions, have the advantage in the dispute… A landlord, a farmer, a master manufacturer, a merchant, though they did not employ a single workman, could generally live a year or two upon the stocks which they have already acquired. Many workmen could not subsist a week, few could subsist a month, and scarce any a year without employment. In the long run the workman may be as necessary to his master as his master is to him; but the necessity is not so immediate.”
Given the fact that employers have the upper hand in negotiations – even when employees are unionized – it’s no wonder that corporations are getting everything they want in this low union membership environment; government bailouts, tax payer funded sports arenas, free trade agreements, tax credits, Right-to-Work laws, etc. The result of all this corporate power hasn’t done a thing to create jobs. But it has led to record high profits.

Corporate Profits as a fraction of GDP.
Typically, weak economies are characterized by high unemployment and low inflation, while strong economies are characterized by low unemployment and higher inflation. This makes intuitive sense – a strong economy creates more demand for goods and services causing price inflation. It also creates more demand for workers which can lead to a rise in wages.
The economy of the 1970’s was different. Throughout the 1970’s both inflation and the unemployment rate moved higher. The high inflation of the 1970’s implied that demand was strong – suggesting the problem was weak supply. This led to the supply-side economic policies of the Reagan administration.
The main tool of these supply-side (aka trickle-down) policies was tax cuts. The idea being that if you cut taxes for people at the top, there would be an increase in investment capital which would lead to more business investment and higher supply. The effects of these tax cuts would then trickle-down to everyone else through lower unemployment and a stronger economy.
Looking at the conditions which existed in 1981, this made a lot of sense. The stock market was significantly undervalued and interest rates on bonds were high. Both of these conditions suggest a shortage of investment capital.
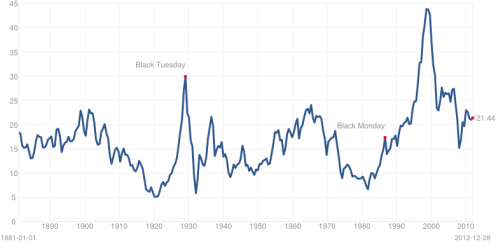
In January 1981, the Shiller PE was 9.26 – about 38% below it’s historical average of 15. Today, it is 21.44 – about 43% above it’s long-term average.
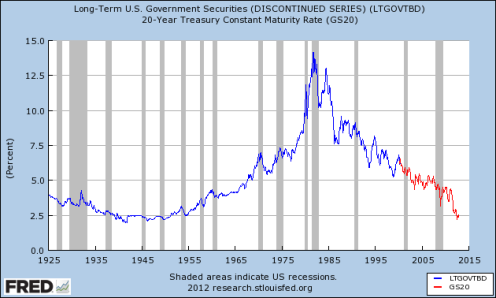
In January 1981, long term treasury bond rates were over 11.5%.Today, they are at historic lows.
After the implementation of supply-side policies, both the stock and bond markets staged strong rallies. Those policies appear to have worked.
Today, however, we have the opposite problems – the stock and bond markets are both well above historical averages. This is clear evidence that there is plenty of investment capital, and no supply-side issue.
The current economy is experiencing an old fashioned demand-side problem. Implementing more supply-side policies now it will only make things worse.
The current National Debt is about 73% of GDP and is expected to reach 80% in two years. However, the American Taxpayer Relief Act passed on January 1 to avoid the Fiscal Cliff is expected to reduce the National Debt to about 77% of GDP in 2018.
The Center on Budget and Policy Priorities has generated the following graph. The orange line shows the expected debt with currently implemented spending cuts and tax increases.

Considering the National Debt reached 120% of GDP after WWII, these levels are manageable, and the short-term problem of rapidly increasing debt has largely been solved.
However, without further action, the debt will begin increasing again after 2018. This is mostly due to rising health care costs and an aging population. At some point in the not too distant future, entitlement spending will need to be addressed. Demographics and health care costs make this unavoidable.
Yesterday, the Congressional Research Service released a report titled, “Taxes and the Economy: An Economic Analysis of the Top Tax Rates Since 1945“. The goal of this report was to determine if raising the top tax rates – as President Obama wants to do – would have an adverse effect on the economy and growth. The report concludes that it wouldn’t.
Throughout the late-1940s and 1950s, the top marginal tax rate was typically above 90%; today it is 35%. Additionally, the top capital gains tax rate was 25% in the 1950s and 1960s, 35% in the 1970s; today it is 15%. The real GDP growth rate averaged 4.2% and real per capita GDP increased annually by 2.4% in the 1950s. In the 2000s, the average real GDP growth rate was 1.7% and real per capita GDP increased annually by less than 1%. This analysis finds no conclusive evidence, however, to substantiate a clear relationship between the 65-year reduction in the top statutory tax rates and economic growth. Analysis of such data conducted for this report suggests the reduction in the top tax rates has had little association with saving, investment, or productivity growth. It is reasonable to assume that a tax rate change limited to a small group of taxpayers at the top of the income distribution would have a negligible effect on economic growth. For instance, the tax revenue projected from allowing the top tax rates to rise to their pre- 2001 levels is $49 billion for 2013 or 0.3% of projected 2013 gross domestic product.
However, the report does conclude that lower top marginal tax rates appear to increase income inequality.
The top tax rate reductions appear to be associated with the increasing concentration of income at the top of the income distribution. The share of income accruing to the top 0.1% of U.S. families increased from 4.2% in 1945 to 12.3% by 2007 before falling to 9.2% during to the 2007-2009 recession. During a portion of that time period, however, the share of the tax burden borne by top taxpayers increased. For instance, the top 0.1% of taxpayers paid 9.4% of all income taxes in 1996 and 11.8% in 2006, but their share of income paid in taxes decreased from 33% in 1996 to 25% in 2006.
Today in Michigan, the GOP controlled legislature passed a pair of right-to-work bills covering public and private sector unions. Like most labels, this one is very misleading. It doesn’t give anyone the “right to work”. What it does is allow people to work in unionized industries without joining or paying dues. They still get all of the benefits of union membership – higher wages and benefits – but without the cost. A more descriptive name for this law would be “right-to-freeload”. In the long run, however, it will inevitably weaken unions in the state – which is the true intent of laws such as these.
But are unions really the problem? Union membership is already at historic lows. It’s hard to believe that any of our recent economic problems can be blamed on unions.
In the bigger picture, this is just another step in America’s race to the bottom. Twenty three other states had already passed right-to-work laws. Now, in order to compete with those states, Michigan is passing it’s own legislation.
As more and more states pass laws like these, we can expect already low union membership rates to decline even more. And as they do, we can expect middle class wages to fall right along with them.
But this is good news for the 1%! As worker pay continues it’s slide, Corporate Profits should continue to set new highs. As a percent of GDP, they are now at 11% – almost $1 trillion above average.
If that money was going to wages instead, it would probably close the GDP output gap – also at about $1 trillion. If so, the economy would be at potential and we would have full employment. This year.
In my previous post, Do Tax Cuts Hurt Growth?, I presented evidence from Piketty, Saez and Stantcheva that low tax rates lead to higher income inequality.

Since the introduction of the income tax in 1913, there have been three periods where the top marginal tax rate was below 40%:
- 1913-1917.
- The late 1920’s.
- 1986-present.
These are also the three periods of highest income inequality. The years between WWII and 1982 saw tax rates above 70% and the lowest income inequality. Why would this be the case? The answer is fairly simple.
When the top tax rate is high, it doesn’t make sense for corporate executives to pay themselves lavish salaries, since most of each additional dollar they pay themselves will be taxed away. Rather, it makes more sense to re-invest that money into their business and increase their employees’ pay and benefits. Not only do these actions reduce income inequality, but they also have the added benefits of attracting better employees, reducing turnover and increasing employee loyalty – all helping to ensuring the company’s longer-term prosperity.
However, when the top tax rate is low, there is a big incentive to reduce worker pay and benefits in order to increase executive compensation.
Back in June, I analyzed the causes of the National Debt’s sharp increase between 2001 and 2011. I concluded that 12% of the increase was due to Obama’s policies, and the remaining 88% was caused by the policies of George W. Bush and the effects of two recessions.
The Center On Budget And Policy Priorities (CBPP) has recently performed an analysis for future deficits, with a similar finding.
The events and policies that pushed deficits to these high levels in the near term were, for the most part, not of President Obama’s making. If not for the Bush tax cuts, the deficit-financed wars in Iraq and Afghanistan, and the effects of the worst recession since the Great Depression (including the cost of policymakers’ actions to combat it), we would not be facing these huge deficits in the near term. By themselves, in fact, the Bush tax cuts and the wars in Iraq and Afghanistan will account for almost half of the $18 trillion in debt that, under current policies, the nation will owe by 2019. The stimulus measures and financial rescues will account for less than 10 percent of the debt at that time.
As usual, a picture is worth a thousand words:

They also estimate that, going forward…
Just two policies dating from the Bush Administration — tax cuts and the wars in Iraq and Afghanistan — accounted for over $500 billion of the deficit in 2009 and will account for $6 trillion in deficits in 2009 through 2019, including the associated debt-service costs. By 2019, we estimate that these two policies will account for almost half — nearly $9 trillion — of the $18 trillion in debt that will be owed under current policies.

